AGU RESEARCH

Columns that reveal the world
- Getting up close and personal with the researchers -

In the world we live in,
From issues close to us to issues that affect all of humanity,
There are many different problems.
The current situation and truth that are surprisingly unknown,
Our proud faculty members offer interesting insights
We will reveal it.

  • Faculty of Business Administration, Department of Business Administration
  • Present accurate and objective information to encourage appropriate decision-making throughout society
  • Professor Masuo Araki
  • Faculty of Business Administration, Department of Business Administration
  • Present accurate and objective information to encourage appropriate decision-making throughout society
  • Professor Masuo Araki

Collecting "meaningful data" to accurately reflect the realities of society

Statistical surveys created by national administrative agencies and local public organizations are called official statistics. They are widely used as basic information for decision-making by both the public and private sectors, and are required to accurately reflect the actual state of society. Since they are conducted by the government from a macro perspective, the scale of these surveys is literally big data. Government agencies set up committees to design and improve surveys, and I have participated in these committees as a committee member to help with the work of the national government. I have considered what questions should be asked of survey subjects, households and companies, devised new survey items to obtain information that is in line with the current situation, and analyzed survey data after the survey.

In many cases, official statistics, such as the national census or economic census, are conducted continuously from the past, and it is rare to design a questionnaire from scratch. In most cases, we start by considering how to improve an existing questionnaire. For example, how do we understand the impact of the rapid spread of electronic payments in recent years on consumption? Even the mere fact of purchasing chocolate, is exchanging it for points that you have accumulated a consumption? In the first place, can we consider accumulating points as income? It is also important to organize the concepts related to the survey items prior to the survey. In addition, it is necessary to pay attention to the scrutiny of questions, such as words and phrases, so that the intention of the question is conveyed correctly, and sometimes research is conducted in advance to see what kind of answers will be returned when what questions are asked. Although questionnaires appear easy to understand on the surface, they are actually carefully designed to collect "meaningful data".


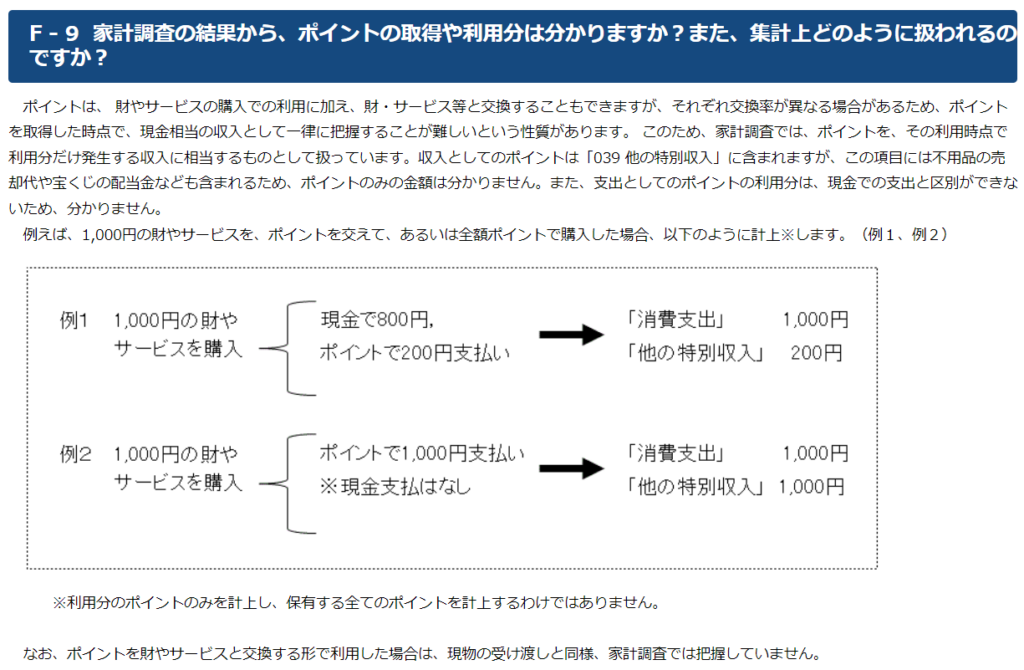
"Can I find out how many points I have earned and used from the results of the household budget survey? Also, how are they treated in the calculation?"


As an example of data analysis using official statistics, in recent years, we have been interested in developing a new indicator called "inter-industry distance" to classify industries in corporate statistics. In general, if there are the automobile industry, the aircraft industry, and the agriculture industry, we intuitively imagine that the automobile industry and the aircraft industry are close in terms of transporting people and goods, and agriculture is farther away in comparison. Where does that sense of "closeness" come from? Wouldn't it be interesting if we could express that sense of distance in numerical terms? Data science makes this possible. Of course, "inter-industry distance" does not exist in actual physical space. So we first define "inter-industry distance". Then, using statistical data called the "industry input-output table" compiled by the Ministry of Internal Affairs and Communications, which summarizes how goods and services are exchanged between each industry, we focus on the list of raw materials that an industry inputs to produce one unit of a product. Then, using something like a raw material recipe for each industry, we measure the degree to which these recipes are similar to each other by applying the definition of "inter-industry distance" using the mathematical concept of vectors.

Vectors are covered in high school mathematics, but when you are studying them, you may have felt that they were abstract and elusive, and wondered what they were useful for. However, at university, they are one of the useful tools that can be used when there is a theme you want to analyze, as I use them in my research. The mathematics you are learning now, not just vectors, will come in handy when you come across something you want to analyze, and you will think, "That might be useful." It will also be an opportunity to get in touch with the world of data science, so although it may be difficult now, I hope you will continue to study.

Does Data Science Need Math?

Recently, I have been asked by students more and more often, "Is mathematics necessary for data science?" I think the answer varies depending on the research field and the field of practice. The knowledge and skills required are different for those who plan and conduct surveys and generate data, and those who use the data obtained from the survey. Regarding data analysis methods, there will also be differences between those who develop methods and those who use them. In terms of numbers, there are relatively more people who "use" data and analysis methods. In this user position, it may not necessarily be necessary to have advanced knowledge of mathematics. It is healthy for the number of users who use data science to increase across the boundaries between the humanities and sciences, and I think it will lead to the development of the entire field. On the other hand, people who are involved in generating socially useful data and developing data analysis methods need a certain level of mathematical ability. However, both the developers and users are data scientists. Looking more closely, there are various ways to get involved in data science, and the degree of need for mathematics varies depending on the area of interest and the tasks you want to accomplish.
Also, even if they are not necessarily good at mathematics, it is very significant for people with an academic background in the social sciences to handle data. I have a liberal arts background and Department of Economics at university, but in research activities, specialized knowledge of social trends has become an advantage over mathematics. In recent years, a trend is emerging in which people with diverse backgrounds bring together their respective specialized knowledge to contribute to the development of data science. There is no doubt that mathematics is important, but it cannot be said that mathematics is more important than anything else.


Image of data science drawn by AI (DALL·E)


In the field of data science, there are competitions to see which team can get the best results using the same data. High-performing teams often have people who are knowledgeable about the circumstances of the field where the data was obtained. We call such knowledge specific to the field or field "domain knowledge." For example, a data scientist is entrusted with data and analyzes it to find out how to improve the manufacturing process in a certain factory to produce as many products as possible that reach a certain level of quality. However, the analysis results that the data scientist initially comes up with may not be comparable to the experience and intuition of someone who has been involved in the manufacturing process for a long time and is familiar with the field. Conversely, when analyzing data, the accuracy of the analysis will increase if someone who has "domain knowledge" in the target field participates in the project. The hurdle here is communication between experts. Because they are in different fields of expertise, there are cases where the conversation does not go well even though they are discussing the same thing about the same issue, because they express it in technical terms and concepts from different fields. Even in such cases, by sharing the results of the data analysis, numbers and graphs, that is, by using the same objective information as a common language that anyone can see, the discussion can proceed.

I want public statistics to be used correctly and for constructive discussion to take place.

The idea of presenting evidence based on objective figures that are the same for everyone has been emphasized in the government's policy-making process. In the business world, when considering corporate acquisitions or business investments, decisions are also made based on data. It is often the case that the results of decisions made by experienced people coincide with those derived from data. Even so, the process of carefully discussing each detail while quantitatively showing the reasons for a decision is extremely important. I believe that people who can present such evidence to the world are essential to society, and this is one of the reasons I want many students to study data science.

Providing evidence doesn't depend on hierarchical relationships in the workplace or differences in national circumstances. By showing evidence that can be objectively evaluated with data, constructive discussion can be developed and it is easier to gain the understanding of many people. For those who want to build a global career, I think this is a field worth learning on the same level as language and negotiation skills.

Official statistics require a huge amount of work before the data to be analyzed can be collected, which places a burden on those who fill them out. However, just as health checkups are important for disease prevention, without corporate statistics, demographic statistics, and statistical data on the natural environment, this country cannot properly grasp where the issues lie and what should be done. In order to encourage more people to cooperate with the survey, I would like to analyze the collected data, make policy recommendations, and demonstrate the usefulness of the policy by making the effects of the policy more visible. I have seen many people work hard for official statistics. Therefore, I have respect for the collected data. Falsification is not permitted, and I believe that using the data correctly is a way to give back to the many people involved in the survey. It may be idealistic, but it has been the driving force behind my research since the old days.


Government Statistics Portal (e-Stat)

Related articles

  • "Data Science as Liberal Arts (Introduction to Data Science Series)" by Seiichi Uchida, Yoshinori Kawasaki, Daisuke Kouchu, Jun Sakuma, Hiroshi Shiina, Yuji Nakagawa, Tomoyuki Higuchi, and Hiroshi Maruyama, edited by Genshiro Kitagawa and Akimichi Takemura (Kodansha: 2021)
  • "Statistics is the most powerful science [Mathematics] -- A new textbook for data analysis and machine learning" by Hiromu Nishiuchi (Diamond Publishing: 2017)
  • "Standard Statistical Analysis of Economic Data" by Yasuto Yoshizoe, Masuo Araki, Hitoshi Motoyama, edited by Manabu Iwasaki, Hiroshi Saigo, Masaaki Taguri, and Hiroko Nakanishi (Baifukan: 2020)
  • "A Study on the Quantitative Evaluation of Inter-Industry Distance Using Input-Output Tables," Tomohiro Goto, Ibuki Hoshina, and Masuo Araki, Aoyama Business Review Vol. 56, No. 4, pp. 241-266 (Aoyama Gakuin University Business Association: 2022)

Study this topic at Aoyama Gakuin University

School of Business Department of Business Administration

  • Faculty of Business Administration, Department of Business Administration
  • Professor Masuo Araki
Link to researcher information

Related Keywords

Related Content

  • Graduate School of Professional Accountancy
  • Where there is economic activity, there is accounting
  • Professor Shinji Hatta
  • When people hear the word "accounting," many will think of "financial calculations" and "a subject studied by certain people involved in accounting and finance." However, in reality, "accounting" is about "correctly explaining economic activity" and "fostering multifaceted thinking," so it is a subject that should be studied by many people. In this column, we explain "what is accounting" and discuss the significance of "studying accounting." (Published in 2013)

  • Faculty of Business Administration, Department of Business Administration
  • Turning expertise into social benefit.
    Exploring data science to create more value
  • Associate Professor Ibuki Hoshina
  • Statistical modeling is a method of deriving mathematical models from data that represent the structures behind the data, which can be used to predict and interpret various phenomena. Associate Professor Hoshina is working to develop new methods that apply existing theories, aiming to create models with higher prediction accuracy and versatility. By taking advantage of the strengths of theoretical research and introducing methods to society that allow for error-free data analysis even without specialized knowledge, he looks toward a future in which anyone can make the most of the benefits that data science offers. (Published in 2023)

  • Faculty of Social and Information Studies
  • Let's use the economic effects of tourism to help revive the economy
  • Professor Toru Nagahashi
  • "Tourism" is enjoyed as a leisure activity. While unraveling the history of tourism, we look at how tourism has become a form of "trade" and a major industry that supports the country. What should Japan do in the future to become a "tourism-based nation"? (Published in 2012)

Related Content

  • Faculty of Business Administration
  • Exceeded the number
    Communication leads
    The present and future of accounting
  • Professor Kenichi Yazawa

  • Faculty of Business Administration
  • What will the TPP bring to our country?
  • Professor Nobuto Iwata

  • Faculty of Economics Department of Economics
  • The impact of economic activity on the environment
    Combining engineering and economics perspectives
  • Professor Shigeru Matsumoto